Aignostics Atlas Series: Atlas H&E-TME
Comprehensive analysis of the tumor microenvironment (TME)
Overview
Built using the foundation model we co-developed with Mayo Clinic, Atlas H&E-TME enables deep, accurate, and scalable spatial analyses of the TME in H&E-stained whole-slide images at single-cell resolution, empowering researchers with crucial insights for oncology drug development. Atlas H&E-TME has been extensively validated and provides qualitative polygon outputs that can be integrated into your preferred IMS, as well as thousands of higher order quantitative outputs per image.
Key advantages
Built with Atlas
Atlas H&E-TME is powered by Atlas, the industry-leading histopathology foundation model co-developed by Aignostics and Mayo Clinic.
Robust and rapid insights for every image
Atlas H&E-TME delivers comprehensive, validated analyses for cells, tissues, and higher order spatial networks, all within hours.
You control your data
Atlas H&E-TME is GDPR-compliant and developed under ISO 27001 information security standards. Your data and results are protected during processing and transit, then automatically deleted from our network.
Get started with a free trial
Atlas H&E-TME is currently available for biopharma and diagnostics companies, with an academic version planned for 2026. All new customers are eligible for a free trial.
Try Atlas H&E-TME on your slides
Interested in seeing how Atlas H&E-TME performs on your images? Your data will be securely transferred, analyzed, and deleted after the free trial.
Try Atlas H&E-TME on our slides
Interested in getting a closer look at Atlas H&E-TME before analyzing your own data? Use our images instead.
Ready to start your trial? Submit the form and let us know.
Atlas H&E-TME is intended for research use only. Not for use in diagnostic procedures.
Unlock insights across your drug development pipeline
Exploratory Research
- Combine outputs with IHC, spatial transcriptomics, and mIF
- Integrate TME profiling and multi-omics data to uncover disease drivers and identify novel targets
Translational Research
- Associate tumor profiling details with patient outcomes to identify new biomarkers
- Reliably quantify complex biomarkers (ex. TILs and TAMs) at scale
- Predict therapy response to identify and segment patient populations
Features
Robust qualitative and quantitative outputs for a range of common cancer types.
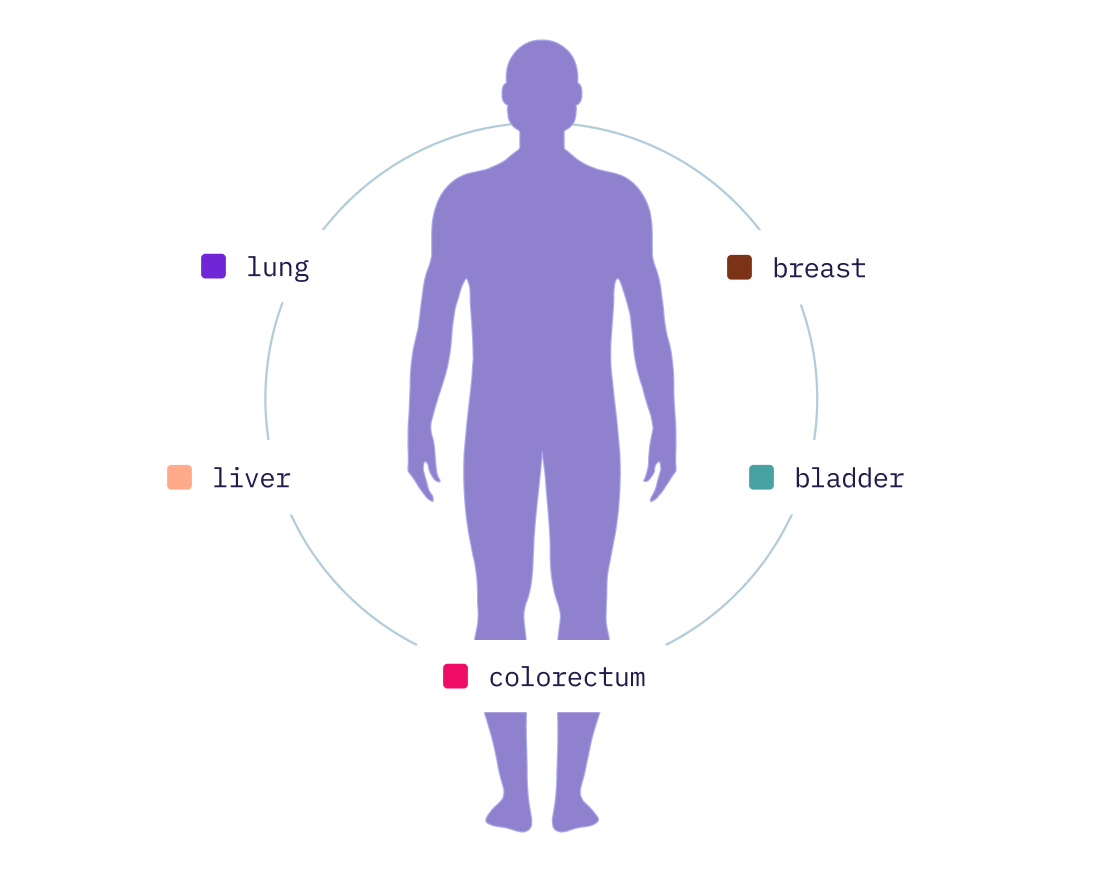
Broad coverage for common cancers
Atlas H&E-TME currently supports analyses for bladder, breast, colorectum, liver (incl. HCC & CCA), and lung cancer (incl. NSCLC & SCLC).
Performance has been validated on at least 90% of invasive morphological subtypes per cancer type, as well as on different tissue types (e.g., primary vs. metastatic) and sample types (e.g., resections, biopsies, FNAs).
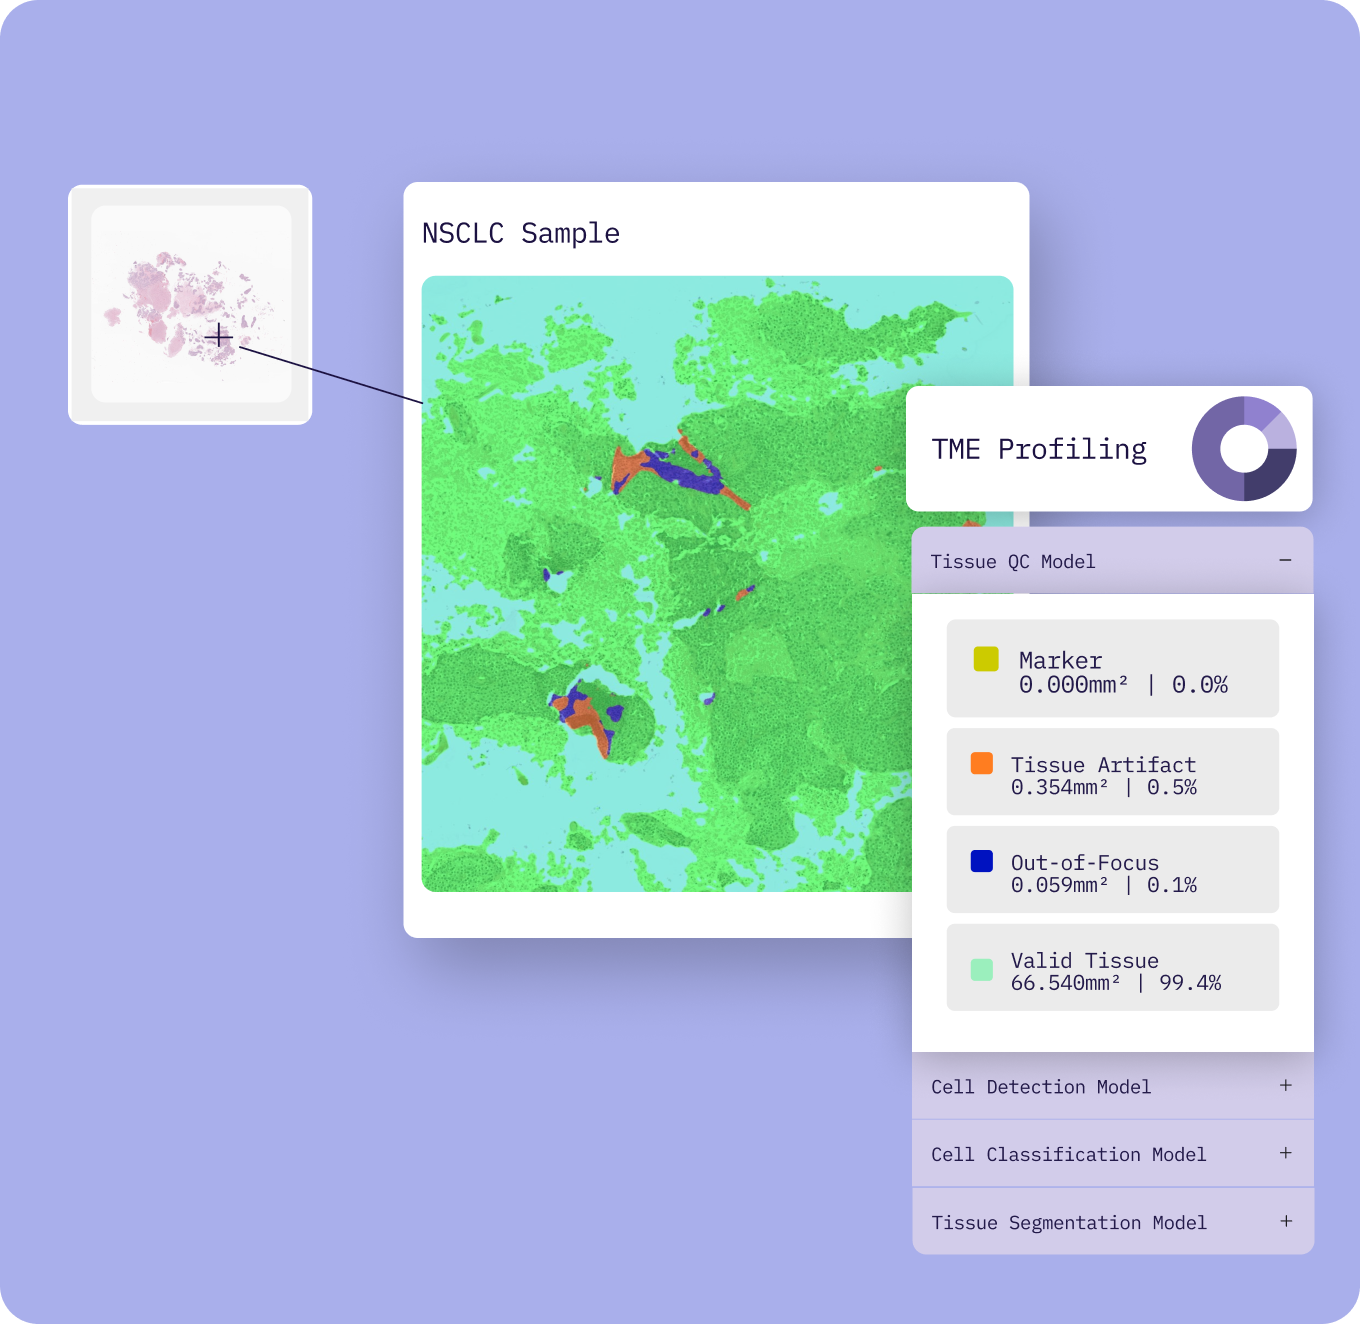
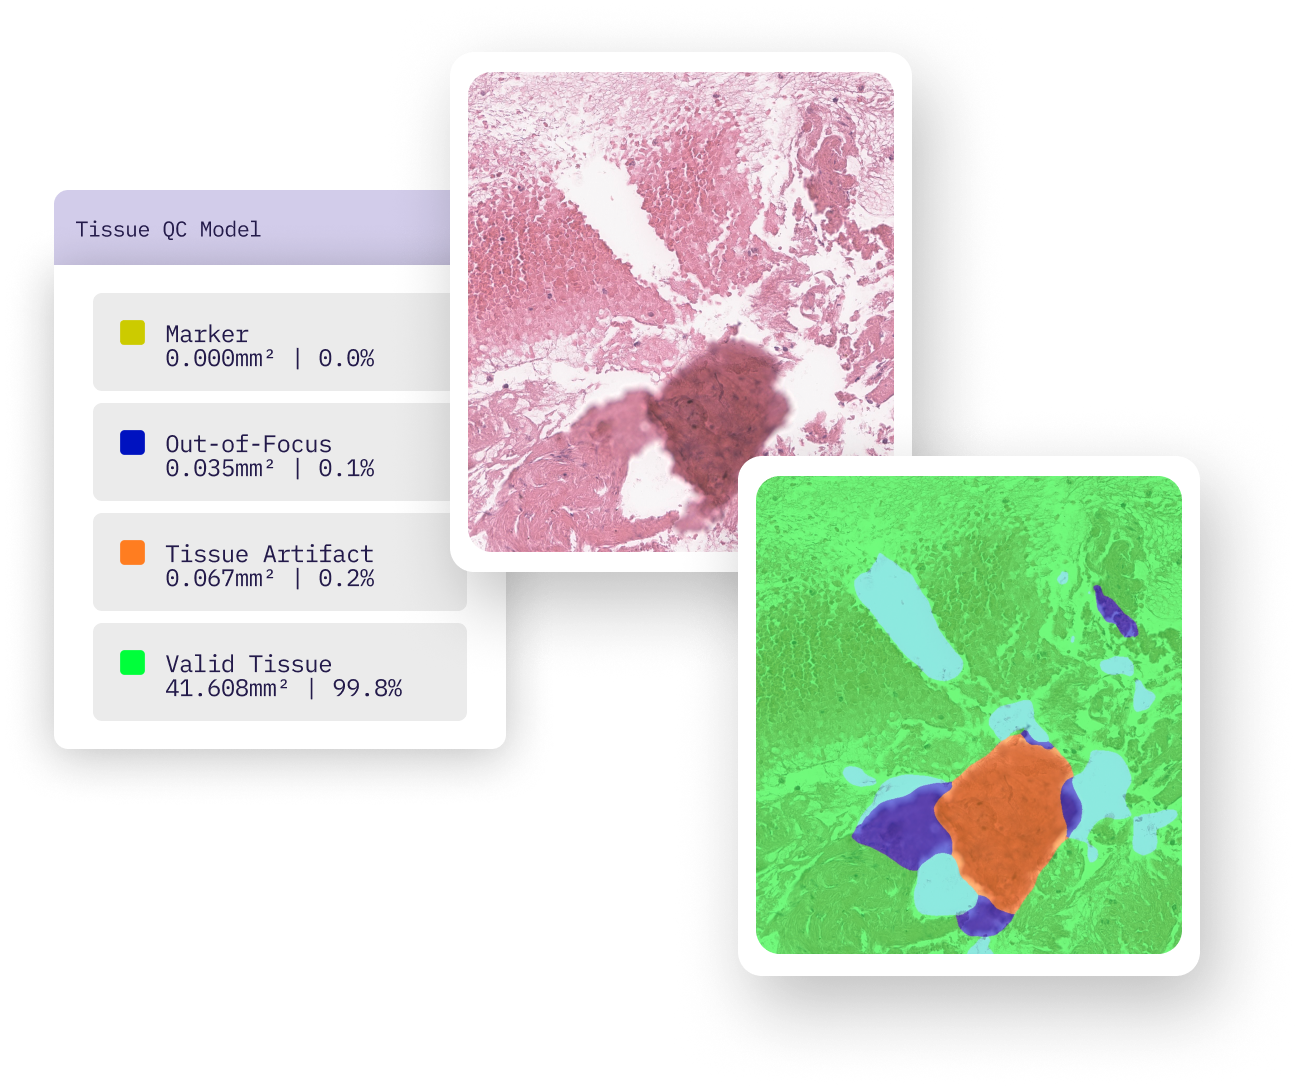
Robust slide quality control
QC models precisely flag areas that should be excluded from downstream analyses.
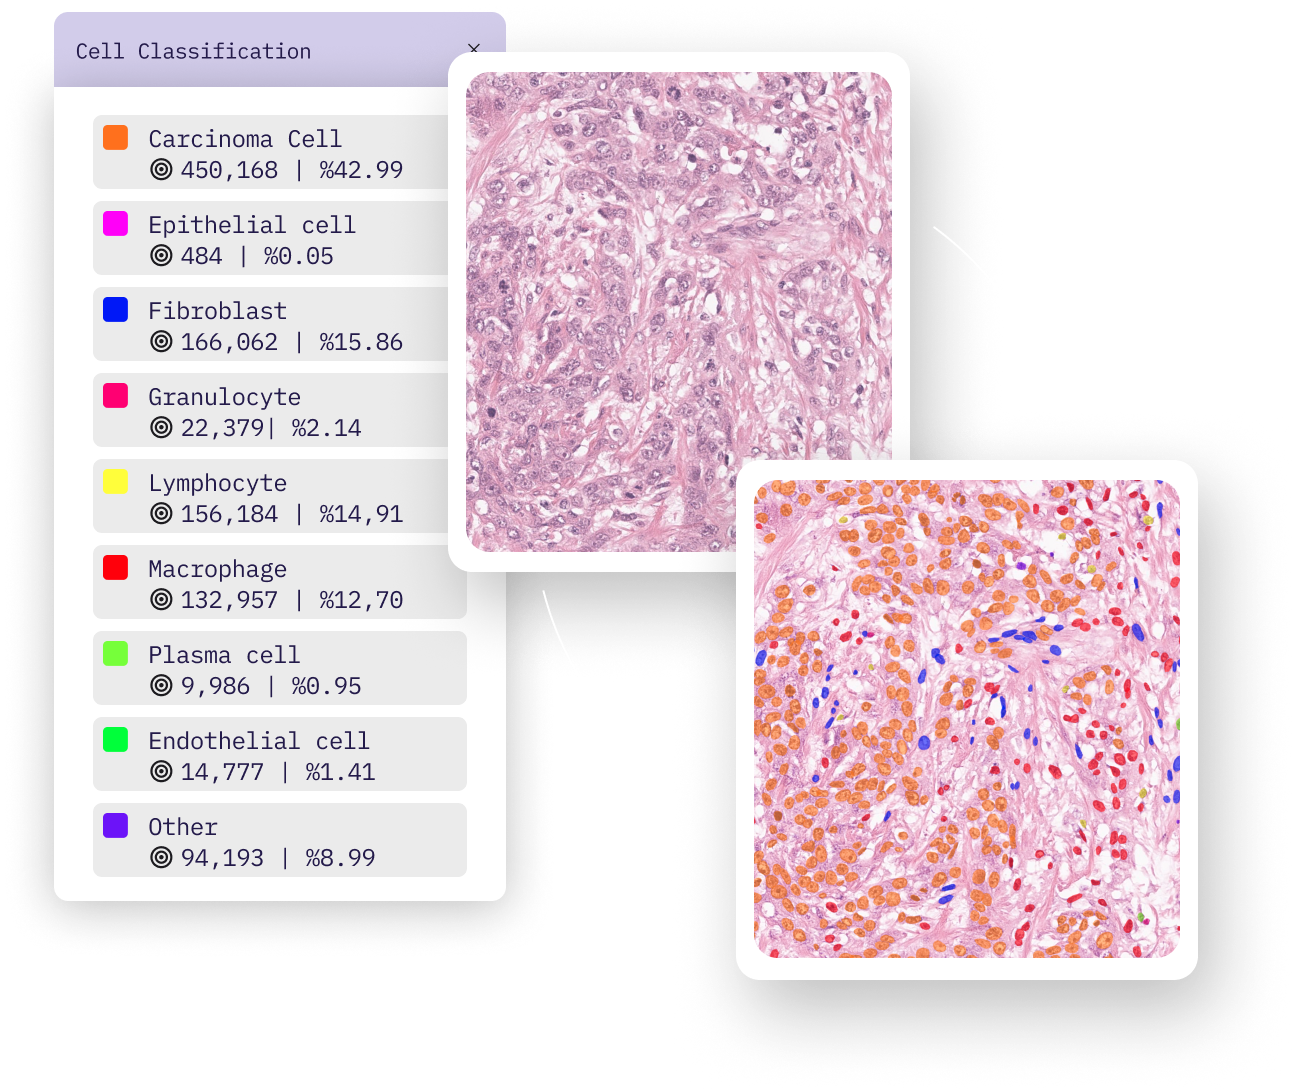
Cell detection and classification
Cell detection models flag individual cells and classify each into one of 9 different classes.
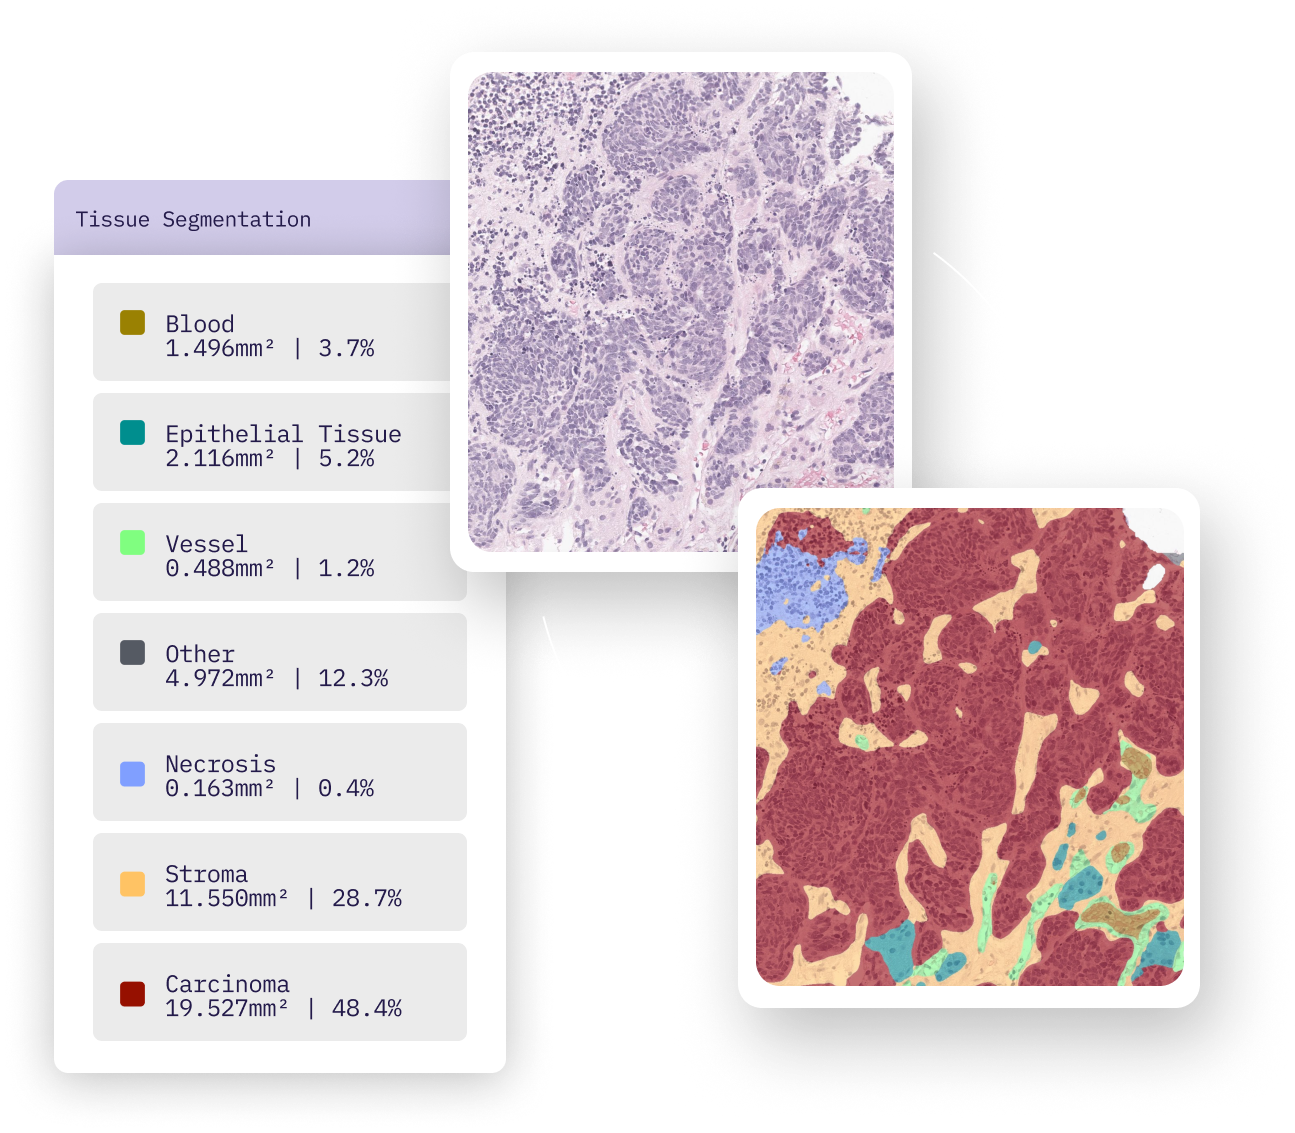
Tissue segmentation
Tissue segmentation models group relevant sections of each whole slide image into one of 7 different tissue regions.
Quantitative readouts
In addition to qualitative outputs, we provide over 5,000 quantitative metrics per image, including QC features and cell, tissue, and neighborhood-level details.